- Details
- Written by: INsane
- Category: DoD:s Console Commands
- Hits: 42612


I take it you know what the net graph is. This information page will touch on the subject of how to position it and other commands.
net_graph "0" - OFF DEFAULT
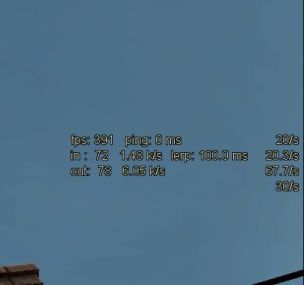
net_graph "1" - A simple graph with basic netcode readings (most popular) that has a default position on the bottom right of the screen
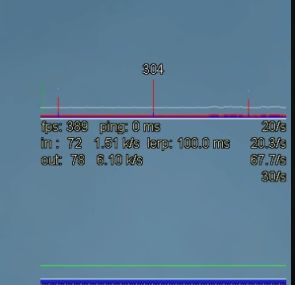
net_graph "2" - A complex graph with more graphical information on the screen for server events
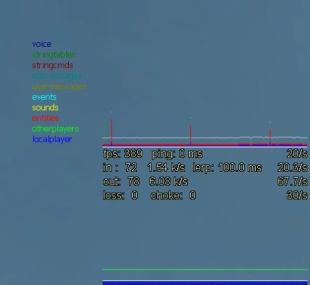
net_graph "3" - Same as above but with a lot more information of the various server events and how they are measuring in real time.
 |
 |
 |
| net_graph "1" | net_graph "2" | net_graph "3" |
The positions are where some people get confused; you can move the Net Graph to any part of the screen using two console commands.
The usual commands and their settings are net_graphheight 64 and net_graphpos 1, those two command will place the Net Graph the lower right corner.
The height is controlled by net_graphheight command this can range from "0" (bottom of the screen) to whatever your screen resolution is…
 |
| This height here is net_graphheight 64, this is taken from the top edge of the netgraph. |
The width is controlled by net_graphpos.
This works differently than the height, there are some settings that are “basic” positions…
net_graphpos 0 (far left)
net_graphpos 2 (middle)
net_graphpos 1 (far right).
If you need to fine tune that, yes you can.
Just select a number between “0” (far left) and “535” (also far right as in “1”) net_graphpos "300' is around the center of the screen.
Strange I know…but it works…
 |
| This width here is net_graphpos 535, this is taken from the left edge of the netgraph |
The reason the width works differently from the height is more than likely the default screen size for the VGUI system … 600 wide by 480 high. 535 + the allowed netgraph width should equal… 600.
So… adjusting is a matter for trail and error and using the method above.
Now looking at those positioning pictures you may have noticed my netgraph is quite small... the text can also be adjusted, want to know how?
net_graphproportionalfont "1" (default) OR "0" off. "Determines whether netgraph font is proportional or not" That is the engine will try to use larger fonts, really only for higher resolutions in the past and will not reduce your font size like the above.
All of the below is from the VALVE wiki... (TF2)
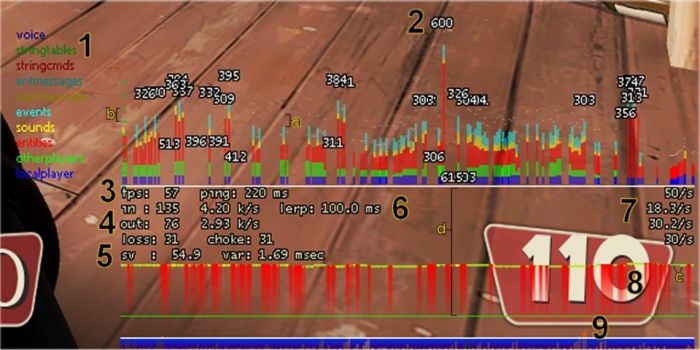
net_graphshowinterp - Draw the interpolation graph portion [area 9 below image]
net_graphshowlatency - Draw the ping/packet loss graph portion [area 8 below image]
net_graphsolid - Draws height ticks as full vertical rectangles, rather than just single ticks [was more important for Half-Life 1/Counter-Strike 1.6 engine since it had a software renderer]
net_graphtext - Draw text fields
net_scale - Varies the scale of the payload portion of the net_graph (units are bytes per pixel). Each green hash mark at the left edge of the payload area represents 50 bytes [see marker "b"], each faint gray tick represents 10 bytes (if scale is sufficiently low)
 |
| The areas of the netgraph - Type 3 (net_graph "3") shown. |
This area is the legend for the colors used in the payload section of the graph. If a part of the payload arrives but doesn't fit into one of the predetermined buckets, then it is represented in the clear area between the last color and the little white dot the represents the full packet size [see indicator "a" in image].
For packets greater than 300 bytes which are in the 95th percentile, the size of the packet is rendered in text at the top of the payload area [see marker 2]. Note that the Orange Box tech uses compression on the packets, but the sizes reported in the net_graph payload are based on the decompressed payload size.
The local connection's frames per second and round trip ping to the server are shown in area 3.
This area shows the current bandwidth usage. The in/out show the size in bytes of the last incoming and outgoing packet. The k/s shows the kilobytes per second (rolling average) recently seen in each direction.
This area shows the performance of the server the client is connected to. The "sv" tag shows the fps of the server as of the latest networking update delivered to the client. The "var" shows the standard deviation of the server's frametime (where server fps = 1.0 / frametime) over the last 50 frames recorded by the server. If the server's framerate is below 20 fps, then this line will draw in yellow. If the server's framerate is below 10 fps, then this line will draw in red.
The "lerp" indicator shows the number of msecs of interpolation being used by the client. Some notes on the value of lerp follow below.
This area shows the user's current cl_updaterate setting, the actual number of updates per second actually received from the server, the actual number of packets per second sent to the server and the user's cl_cmdrate setting (which is the user's desired packets per second to send to the server).
When net_graphshowlatency is 1, this area shows a historical view of the latency of the connection. The height (indicated by marker "d") corresponds to net_graphmsecs time (actually there is a bit of headroom after net_graphmsecs at the top for the text fields to fit into). Red vertical lines indicate dropped packets from the server down to the client. If the graph shows a yellow marker (such as at marker "c"), this indicates that the server had to choke back one or more packets before sending the client an update.
When net_graphshowinterp is 1, this area shows for each client frame how much interpolation was needed. If there is a large gap between packets (packet loss, server framerate too low, etc.), then the client will have insufficient data for interpolation and will start to extrapolate. The extrapolation is shown as orange bars rising up above the while line (a run of extrapolation can be seen just to the left of the 9 marker). In addition, the very bottom pixel indicates whether a CUserCmd ("usercmd") packet was sent on that rendering frame, or held back by the client and aggregated due to the user's cl_cmdrate setting.
Using net_graph 3 is a way to analyze performance issues.
Here is what you should focus on using the netgraph.
Use net_graph "3" for this, then switch back to net_graph "1" after investigating in depth.
Key Metrics to Monitor in net_graph 3.
FPS (Frames Per Second):
Look for consistent frame rates. Dropped frames or sudden dips (e.g., below 60 FPS) can indicate that the system is struggling to handle the higher resolution.
If FPS fluctuates significantly, it may point to GPU or CPU bottlenecks.
Ping (Latency):
Ensure the ping remaining stable. High or spikes in latency could indicate network issues, (local and web).
Packet Loss:
Watch for any packet loss percentages.
Small amounts of packet loss can cause stuttering or lag, these may feel worse at higher resolutions due to increased rendering demands, you could be running too many things on your PC, you could be playing with bots (RCBot2) and have too many bots for your hardware or too many plugins running.
Choke:
This measures how much data the server is trying to send but cannot due to bandwidth limitations.
High choke values can lead to input lag or delayed actions.
SV (Server Frame Time):
This shows the server's processing time per frame. If the server struggles to keep up (e.g., SV values spike), it can cause desync or lag.
VAR (Variance):
High VAR values indicate inconsistent frame times, which can result in stuttering or uneven gameplay. This is particularly important at higher resolutions, where rendering demands are greater.
IN/OUT (Data Rates):
These show the amount of data being sent to and from the server.
If these values are unusually high or low, it might indicate a mismatch between the game's settings and the server's capabilities.
Troubleshooting Tips for Video related "lag":
Lower Resolution Temporarily:
Adjust Graphics Settings:
Monitor Hardware Usage:
Designed by INsane Webmaster - dodbits.com using Template Toaster (Joomla! Version 4)
